Summary:
Choosing the right quality metrics is only part of the challenge. The real value lies in knowing what to measure, how to interpret the results, and when to act on them. This guide explores the metrics that matter across a QMS, explains how they support better decisions, and shows how to build a quality measurement program that drives continual improvement.
Quality metrics often provide the earliest indication that a quality management system is drifting from expected performance.
For example, a supplier’s defect rate may begin to rise, corrective actions may take longer to close, or the same audit finding may reappear despite being marked as resolved. Individually, these issues may not seem unusual. Together, they can indicate that quality performance is beginning to decline.
The challenge is that these warning signs are often spread across different QMS processes and reviewed independently. Without clear, well-defined quality metrics to bring them together, it’s difficult to identify recurring issues, evaluate whether corrective actions are delivering lasting results, or recognize declining process performance before the impact becomes significant.
The importance of clearly defining and consistently tracking quality metrics becomes even more evident when viewed alongside the cost of poor quality. According to the American Society for Quality (ASQ), quality-related costs account for an estimated 15% to 20% of annual sales for many manufacturers. That underscores the importance of defining and consistently monitoring quality metrics that provide objective insight into process performance, support timely decision-making, and drive continual improvement across the QMS.
What are Quality Metrics?
Quality metrics are measurable indicators used to evaluate the performance of products, processes, or the quality management system itself. They are not the activities performed within a QMS, nor the records those activities generate. Instead, they are the measurements derived from that information to assess how consistently and effectively a process is performing over time.
Consider an internal audit that identifies six nonconformances.
That number by itself is simply an audit record. It tells you what happened during one audit.
A quality metric is created when that information is measured in a way that helps evaluate process performance. For example:
- Audit record: Six nonconformances identified.
- Quality metrics:
- Repeat finding rate: How many of those findings have appeared in previous audits?
- Audit finding closure rate: What percentage of findings were closed within the agreed timeline?
- Average closure time: How many days did it take to close each finding?
Unlike a single audit record, these metrics can be tracked over time to determine whether the audit process is improving, remaining stable, or gradually becoming less effective, providing quality assurance teams with objective evidence for performance evaluation.
The same principle applies across every QMS process. Records tell you what happened. Quality metrics tell you what those records mean.

Quality Metrics vs. Quality KPIs—What’s the Difference?
The distinction is simple: every quality KPI is a quality metric, but not every quality metric is a KPI. Metrics measure process performance, while KPIs are the few metrics selected to evaluate progress toward a specific quality objective and drive management decisions.
| Comparison Criteria | Quality Metric | Quality KPI |
|---|---|---|
| Purpose | Measures a process, product, or system | Measures progress toward a strategic quality objective |
| Ownership | Used by process owners and quality teams | Used by leadership during performance reviews |
| Governance | May be monitored operationally | Has a defined target, owner, and review schedule |
| Example | Average CAPA closure time | ≥95% of CAPAs closed within 30 days |
An effective quality measurement program doesn’t elevate every metric to a KPI. Instead, it identifies the few measures that consistently inform management decisions while allowing operational metrics to guide day-to-day process management.
A practical way to decide whether a metric should become a KPI is to ask one question: Would leadership act if this number moved in the wrong direction?
If the answer is yes, it belongs on the KPI dashboard. If not, it’s still valuable—but better suited for operational monitoring.
The ISO 9001 Obligation—Why You Must Measure
If your organization operates under ISO 9001:2015, measuring quality performance is a requirement, not an option.
This expectation is outlined in Clause 9 – Performance Evaluation.
Clause 9.1 requires organizations to determine what needs to be monitored and measured, how those measurements will be made, and when the results will be analyzed.
Clause 9.3 then requires top management to review that information to evaluate whether the QMS is achieving its intended results and identify opportunities for improvement.
Understanding the broader quality management principles of ISO 9001 also helps explain why performance measurement plays such an important role in maintaining an effective QMS.
Simply put, ISO defines the requirement for measurement, not the metrics themselves.
In practice, certification auditors often focus less on how many metrics are tracked and more on whether those metrics have influenced decisions and improvements. They typically follow a simple sequence:
Metric → Trend → Decision → Action
If supplier defects have increased for three consecutive months or CAPA closure time has steadily risen, the next question is simple: What changed, and what action was taken?
The objective isn’t to verify that metrics exist. It’s to determine whether those metrics are influencing decisions, driving continual improvement across the QMS, and supporting compliance with leading quality management standards.
Use it to identify meaningful quality KPIs, build effective dashboards, and turn performance data into better management decisions.
Download the GuideExamples of Quality Metrics Mapped Across QMS Process Areas
No single metric can accurately represent the performance of an entire quality management system. That’s why quality metrics are typically mapped to individual QMS processes, with each process measured using the indicators most relevant to its objectives. Together, these process-level metrics provide a more complete view of overall QMS performance and help identify where improvement is needed.
The examples below highlight commonly used metrics for key QMS processes. Rather than tracking every metric, organizations should select those that best align with the objectives, risks, and maturity of each process.
-
Metrics for CAPA
-
Metrics for Internal Audits
- Findings per audit (trend over time, not absolute count)
- Audit findings closed (within the committed timeline)
- Repeat findings rate
- Average time from finding to verified closure
-
Metrics for Nonconformance (NC) Management
- NC rate by process area
- Average NC cycle time (identification to disposition)
- Cost of poor quality related to nonconformance, such as rework, scrap, retesting, warranty, or complaint handling
- NC recurrence by root cause category
-
Metrics for Supplier Quality
- Supplier defect rate or lot acceptance rate
- On-time delivery rate
- Supplier CAPA response time
- Audit findings per supplier audit
- Supplier corrective action closure rate
- Supplier Quality Rating / Score (defect rate delivery performance, audit results, CAPA responsiveness, and incoming rejection rate)
-
Metrics for Document Control
- Document review cycle time
- Percentage of documents reviewed on schedule
- Overdue document count
- Availability of current approved documents at the point of use
-
Metrics for Training
- Training effectiveness score (post-training assessment results)
- Compliance with the role-based training matrix
- Training overdue by function or department
- Training completion rate linked to nonconformance occurrence (Correlation between training status/effectiveness and related nonconformance trends)
Each CAPA metric answers a different question—from how efficiently corrective actions are completed to whether they prevent similar issues from recurring. Reviewing these metrics together provides a more reliable assessment of CAPA process effectiveness.
| Metric | What it helps evaluate |
|---|---|
|
CAPA closure rate |
Whether corrective actions are completed within the committed timeframe |
|
Recurrence rate |
Whether corrective actions are effectively eliminating the root cause |
|
Average CAPA cycle time |
Efficiency of investigation, approval, and implementation |
|
Overdue CAPA count |
Accumulation of unresolved corrective actions |
A high CAPA closure rate combined with a rising recurrence rate often indicates that actions are being completed on time, but the underlying causes are not being effectively addressed.
No single audit metric reflects the effectiveness of an audit program. While one metric may show how consistently audits are performed, others reveal whether audit findings are being addressed and contributing to continual improvement.
For example, a declining number of findings may indicate improving process performance. However, if the repeat findings rate remains high, it could suggest that underlying issues are not being effectively resolved.
When evaluating nonconformances, a handful of metrics provide the clearest picture of where quality issues are occurring, how they’re being managed, and whether corrective actions are preventing them from recurring.
One metric that is often overlooked is the ratio of internally detected versus externally detected nonconformances. If customers or auditors consistently identify issues before internal teams do, it may indicate weaknesses in the organization’s detection processes rather than simply an increase in quality issues.
Use it to identify the metrics that reveal recurring quality issues, measure process effectiveness, and support continual improvement.
Download the GuideSupplier quality should be evaluated across multiple aspects of supplier performance rather than a single measure. The following metrics help assess product quality, supplier responsiveness, delivery performance, and the effectiveness of corrective actions.
The following metrics help monitor the health of the document control process throughout the document lifecycle.
One metric that’s often overlooked is the percentage of document revisions triggered by process changes, CAPAs, or audit findings. Tracking it helps determine whether documentation is being updated in response to actual operational changes rather than simply to satisfy scheduled review requirements.
Training metrics should measure more than participation. The most valuable indicators help determine whether employees are receiving the right training, completing it on time, and demonstrating competence in their assigned responsibilities.
High training completion rates don’t necessarily indicate effective training. A more meaningful assessment comes from comparing training data with quality outcomes over time. For example, if departments with strong completion rates continue to report recurring nonconformances, the issue may lie in knowledge retention, training quality, or how consistently procedures are being applied.
Use it to measure training effectiveness beyond completion rates and demonstrate workforce competency with greater confidence.
Download the GuideLeading vs. Lagging Indicators: Why Both Matter
Most quality metrics fall into one of two categories: leading indicators, which signal potential quality issues before they occur, and lagging indicators, which measure the outcomes of issues that have already occurred.
| Basis of Comparison | Leading Indicators | Lagging Indicators |
|---|---|---|
|
What they measure |
Process conditions that may influence future quality performance | Quality outcomes that have already occurred |
|
Primary purpose |
Help identify potential risks early | Evaluate the results of past performance |
|
Role in quality management |
Enable proactive action | Measure whether corrective actions were effective |
|
Examples |
Overdue CAPAs, training overdue by department, supplier CAPA response time, document review overdue | Customer complaints, nonconformance rate, CAPA recurrence rate, cost of nonconformance |
Organizations that rely only on lagging indicators often recognize quality problems only after they have resulted in customer complaints, audit findings, or recurring nonconformances.
Leading indicators provide the opportunity to intervene earlier, while lagging indicators help verify whether those interventions delivered the intended results. Together, they provide a more complete picture of QMS performance and support better-informed quality decisions.
Is Your Quality Metrics Program Delivering Real Value?
A quality metrics program should reduce uncertainty, not create more reporting work. If quality data is difficult to trust, difficult to interpret, or rarely influences decisions, the issue may not be the metrics themselves. Instead,
it may be how they’re being measured, maintained, or used.
Some signs that the program needs attention include:
- Management reviews spend more time explaining numbers than deciding actions: When meetings repeatedly focus on validating data or understanding why a metric changed, the discussion shifts away from improvement.
- The same metric produces different values across reports: This often happens when departments calculate metrics differently or rely on disconnected data sources, making it difficult to establish a single, trusted version of performance.
- Performance appears stable, but the same quality issues keep returning : Consistently meeting targets while recurring nonconformances, complaints, or audit findings persist may indicate that the chosen metrics aren’t measuring what actually drives quality performance.
- Reporting requires significant manual effort every review cycle: If quality teams spend days collecting spreadsheets before every management review, they’re maintaining
the reporting process instead of analyzing the results.
Ultimately, the effectiveness of a quality metrics program isn’t determined by the number of metrics on the dashboard. It’s determined by whether those metrics help the organization identify risks earlier, make better decisions, and improve performance over time.
Experience shows that a quality metric is only as useful as its consistency over time. When organizations frequently redefine how a metric is calculated, measured, or reported, for example by tracking supplier defects by defective parts one year and defective lots the next, trend comparisons become difficult, even if the underlying process hasn’t changed.
How a Connected QMS Makes Quality Metric Tracking Sustainable
By this point, one thing becomes clear: effective quality measurement depends on more than selecting the right metrics. It also depends on having reliable, connected data behind every measurement.
Many quality metrics rely on information from multiple QMS processes. For example, evaluating CAPA effectiveness may require linking nonconformance records, corrective actions, audit findings, and customer complaints over time. When those records are maintained in separate spreadsheets or disconnected systems, even simple metrics become difficult to calculate consistently and accurately.
Modern QMS software helps connect these quality processes, making performance data more consistent, traceable, and easier to analyze across the organization.
A connected quality management system addresses this challenge by capturing quality data as work is performed and maintaining relationships between related records automatically. Instead of manually consolidating information before every management review, organizations can generate quality metrics from data that is already structured, traceable, and consistently maintained.
The real value of a connected QMS isn’t that it creates more quality metrics. It’s that every quality activity, whether it’s an audit, CAPA, nonconformance, supplier issue, document revision, or training record, becomes reusable data for performance measurement. As a result, quality metrics become a natural outcome of everyday quality operations rather than a separate reporting exercise.
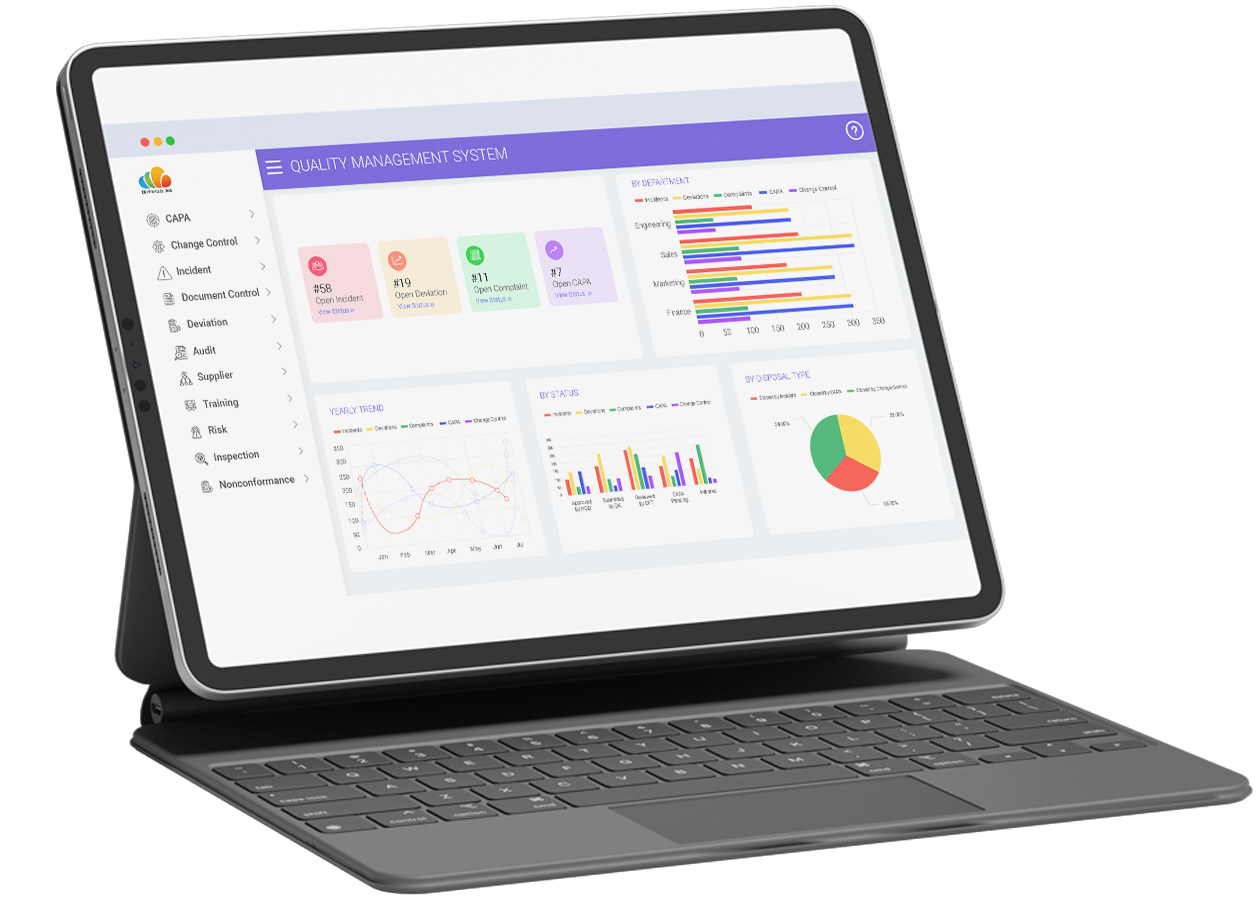
See how BizPortals QCFlow helps manage quality, compliance, and continuous improvement from one connected platform.
Request a Demo